Tutorial 1: Data pre-processing for SMA data
The spatial multimodal analysis (SMA) workflow is designed to detect metabolites and transcriptomes in a single tissue section with retained specificity and sensitivity of both modalities. The pre-processings aim to regist the two spatial multi-omics data of the same sample.
[18]:
import pandas as pd
import numpy as np
import scanpy as sc
import matplotlib.pyplot as plt
import os
import glob
import cv2
import matplotlib.pyplot as plt
Define the path and landmarks
[19]:
mouse = 'V11L12-109'
root = '/home/wzk/ST_data/SMA_data/Zhikang'
save_dir = '/home/wzk/ST_data/SMA_data/Processed_data_v4'
n_top_msi = 50

# for sample 1
mouse_name = 'V11L12-109_A1'
path_rna = '/home/wzk/ST_data/SMA_data/Processed/sma/V11L12-109/V11L12-109_A1/output_data/V11L12-109_A1_RNA/outs'
path_meta = '/home/wzk/ST_data/SMA_data/Processed/sma/V11L12-109/V11L12-109_A1/output_data/V11L12-109_A1_MSI/V11L12-109_A1.Visium.FMP.220826_smamsi.csv'
points_rna = [[18, 10], [55, 11], [60, 12], [65, 13], [54, 18], [98, 32], [125, 58], [46, 35], [71, 44], [50, 62]]
points_meta = [[15, 0], [34, 1], [37, 2], [40, 3], [32, 6], [53, 18], [65, 46], [28, 20], [41, 28], [24, 40]]

## for sample 2
# mouse_name = 'V11L12-109_B1'
# path_rna = '/home/wzk/ST_data/SMA_data/Processed/sma/V11L12-109/V11L12-109_B1/output_data/V11L12-109_B1_RNA/outs'
# path_meta = '/home/wzk/ST_data/SMA_data/Processed/sma/V11L12-109/V11L12-109_B1/output_data/V11L12-109_B1_MSI/V11L12-109_B1.Visium.FMP.220826_smamsi.csv'
# points_rna = [[11, 3], [37, 3], [13, 21], [51, 5], [55, 15], [83, 16], [34, 42], [76, 57], [92, 73]]
# points_meta = [[12, 2], [27, 2], [13, 17], [30, 3], [33, 12], [47, 13], [22, 34], [44, 47], [53, 61]]

## for sample 3
# mouse_name = 'V11L12-109_C1'
# path_rna = '/home/wzk/ST_data/SMA_data/Processed/sma/V11L12-109/V11L12-109_C1/output_data/V11L12-109_C1_RNA/outs'
# path_meta = '/home/wzk/ST_data/SMA_data/Processed/sma/V11L12-109/V11L12-109_C1/output_data/V11L12-109_C1_MSI/V11L12-109_C1.Visium.FMP.220826_smamsi.csv'
# points_rna = [[7, 7], [43, 7], [50, 42], [32, 46], [73, 60], [95, 53], [106, 73] ]
# points_meta = [[8, 1], [29, 1], [32, 31], [23, 34], [43, 45], [54, 40], [60, 58] ]
Select the highly variable metabolites
[20]:
from scipy.sparse import csr_matrix
import anndata as ad

files = glob.glob(os.path.join(root, mouse + '*', '*_smamsi.csv'))

highly_variable_list = []

for file in files:
    msi_file = pd.read_csv(file)
    msi_data_array = msi_file.to_numpy()[:, 2:]

    msi_data_array = csr_matrix(msi_data_array, dtype=np.float32)
    adata = ad.AnnData(msi_data_array)

    sc.pp.highly_variable_genes(adata, flavor="seurat_v3", n_top_genes=n_top_msi)
    highly_variable_list.append(adata.var['highly_variable'])

msi_final_mask = highly_variable_list[0] & highly_variable_list[1] & highly_variable_list[2]
print('length of the highly variable genes {}'.format((msi_final_mask * 1).sum()))
/home/wzk/anaconda3/envs/pytorch_zk/lib/python3.8/site-packages/scanpy/preprocessing/_highly_variable_genes.py:64: UserWarning: `flavor='seurat_v3'` expects raw count data, but non-integers were found.
  warnings.warn(
/home/wzk/anaconda3/envs/pytorch_zk/lib/python3.8/site-packages/scanpy/preprocessing/_highly_variable_genes.py:64: UserWarning: `flavor='seurat_v3'` expects raw count data, but non-integers were found.
  warnings.warn(
length of the highly variable genes 14
/home/wzk/anaconda3/envs/pytorch_zk/lib/python3.8/site-packages/scanpy/preprocessing/_highly_variable_genes.py:64: UserWarning: `flavor='seurat_v3'` expects raw count data, but non-integers were found.
  warnings.warn(
Load Visium data and MSI data
[21]:
rna_adata = sc.read_visium(path=path_rna, count_file='filtered_feature_bc_matrix.h5')
rna_adata.var_names_make_unique()

msi_file = pd.read_csv(path_meta)
/home/wzk/anaconda3/envs/pytorch_zk/lib/python3.8/site-packages/anndata/_core/anndata.py:1840: UserWarning: Variable names are not unique. To make them unique, call `.var_names_make_unique`.
  utils.warn_names_duplicates("var")
/home/wzk/anaconda3/envs/pytorch_zk/lib/python3.8/site-packages/anndata/_core/anndata.py:1840: UserWarning: Variable names are not unique. To make them unique, call `.var_names_make_unique`.
  utils.warn_names_duplicates("var")
Establish the MSI adata
[22]:
import anndata as ad
from scipy.sparse import csr_matrix
msi_data_array_ori = msi_file.to_numpy()[:, 2:]

msi_data_array = csr_matrix(msi_data_array_ori, dtype=np.float32)
msi_adata = ad.AnnData(msi_data_array)
spatial = msi_file[["x", "y"]].values

# be attention here, reverse the y
msi_adata.obs['array_row'], msi_adata.obs['array_col'] = msi_file["x"].values, msi_file["y"].values.max() - msi_file["y"].values
msi_adata.obsm['spatial'] = msi_adata.obs[['array_row', 'array_col']].values
Plot RNA and MSI data in the original coodinates
[23]:
# plot rna and msi
max_x, max_y = rna_adata.obs['array_row'].values.max(), rna_adata.obs['array_col'].values.max()
vis_rna_array = np.zeros((max_x + 1, max_y + 1))
array_rna = rna_adata.X.toarray()
for i in range(rna_adata.shape[0]):
temp_x, temp_y = rna_adata.obs['array_row'][i], rna_adata.obs['array_col'][i]
vis_rna_array[temp_x, temp_y] = array_rna[i, :].sum()
print("rna array shape {}".format(vis_rna_array.shape))
max_x, max_y = msi_adata.obs['array_row'].values.max(), msi_adata.obs['array_col'].values.max()
vis_meta_array = np.zeros((max_x + 1, max_y + 1))
whole_meta_array = np.zeros((max_x + 1, max_y + 1, msi_data_array.shape[1]))
print(whole_meta_array.shape)
print(msi_data_array.shape)
for i in range(msi_adata.X.shape[0]):
temp_x, temp_y = msi_adata.obs['array_row'][i], msi_adata.obs['array_col'][i] #max_y - spatial_ori[i, 1]
vis_meta_array[temp_x, temp_y] = msi_data_array_ori[i, msi_final_mask].sum()
whole_meta_array[temp_x, temp_y, :] = msi_data_array_ori[i, :]
print("rna array shape {}".format(vis_meta_array.shape))
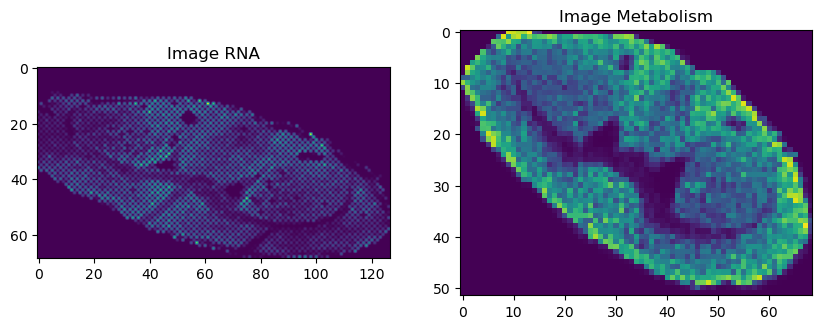
# visualization
fig, axs = plt.subplots(1, 2, figsize=(10, 5))
axs[0].imshow(vis_rna_array)
axs[0].set_title('Image RNA')
axs[0].axis('on')
axs[1].imshow(vis_meta_array)
axs[1].set_title('Image Metabolism')
axs[1].axis('on')
plt.show()
rna array shape (69, 127)
(52, 69, 1538)
(3588, 1538)
rna array shape (52, 69)
Visualize the original data and landmarks
[24]:
vis_rna_array = vis_rna_array/vis_rna_array.max() * 200
for [x, y] in points_rna:
    vis_rna_array[y, x] = 255

vis_meta_array = vis_meta_array / vis_meta_array.max() * 200
for [x, y] in points_meta:
    vis_meta_array[y, x] = 255

fig, axs = plt.subplots(1, 2, figsize=(10, 5))
axs[0].imshow(vis_rna_array)
axs[0].set_title('RNA with landmark')
axs[0].axis('on')

axs[1].imshow(vis_meta_array)
axs[1].set_title('Metabolism with landmark')
axs[1].axis('on')

plt.show()

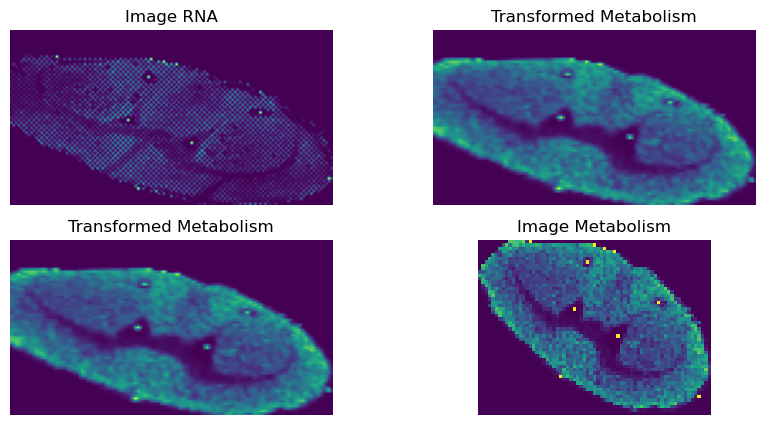
Do the image transformation
[25]:
points_rna, points_meta = np.float32(points_rna), np.float32(points_meta)
M, _ = cv2.findHomography(points_meta, points_rna, cv2.LMEDS)
transformed_img = cv2.warpPerspective(vis_meta_array, M, (vis_rna_array.shape[1], vis_rna_array.shape[0]))
[26]:
fig, axs = plt.subplots(2, 2, figsize=(10, 5))

axs[0, 0].imshow(vis_rna_array)
axs[0, 0].set_title('Image RNA')
axs[0, 0].axis('off')

axs[0, 1].imshow(transformed_img)
axs[0, 1].set_title('Transformed Metabolism')
axs[0, 1].axis('off')

axs[1, 0].imshow(transformed_img)
axs[1, 0].set_title('Transformed Metabolism')
axs[1, 0].axis('off')


axs[1, 1].imshow(vis_meta_array)
axs[1, 1].set_title('Image Metabolism')
axs[1, 1].axis('off')

plt.show()
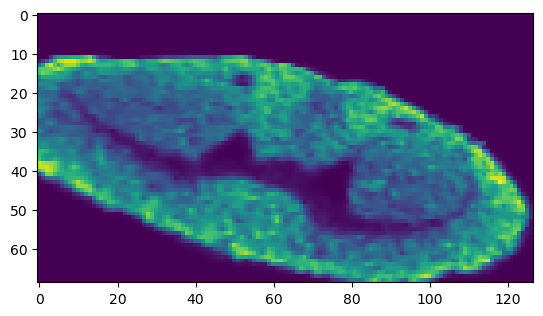
[27]:
affined_whole_meta = []
for i in range(whole_meta_array.shape[2]):
    affined_whole_meta.append(cv2.warpPerspective(whole_meta_array[:, :, i], M, (vis_rna_array.shape[1], vis_rna_array.shape[0])))

affined_whole_meta = np.stack(affined_whole_meta, axis=2)

print('shape of affined image size {}'.format(affined_whole_meta.shape))
plt.imshow(affined_whole_meta[:, :, msi_final_mask].sum(axis=2))
shape of affined image size (69, 127, 1538)
[27]:
<matplotlib.image.AxesImage at 0x7f5a4e2b5520>
[28]:
array_row, array_col, array_msi_value = [], [], []
for i in range(affined_whole_meta.shape[0]):
    for j in range(affined_whole_meta.shape[1]):

        temp = affined_whole_meta[i, j, :]
        if temp.sum() == 0:
            continue
        else:
            array_row.append(i)
            array_col.append(j)
            array_msi_value.append(temp)

array_row, array_col, array_msi_value = np.array(array_row), np.array(array_col), np.stack(array_msi_value, axis=0)
[29]:
saving_array_msi_value = csr_matrix(array_msi_value, dtype=np.float32)
saving_msi_adata = ad.AnnData(saving_array_msi_value)

saving_msi_adata.obs['array_row'], saving_msi_adata.obs['array_col'] = array_row, array_col
saving_msi_adata.obsm['spatial'] = saving_msi_adata.obs[['array_col', 'array_row']].values

saving_msi_adata.var['metabolism'] = np.array(msi_file.columns[2:].tolist())
Visualize RNA and transformed MSI using scanpy
[30]:
sc.pp.highly_variable_genes(saving_msi_adata, flavor="seurat_v3", n_top_genes=2)
sc.pp.normalize_total(saving_msi_adata, target_sum=1e4)
sc.pp.log1p(saving_msi_adata)
saving_msi_adata.obs['sum'] = saving_msi_adata.X[:, saving_msi_adata.var['highly_variable']].sum(axis=1)
rna_adata.obs['sum'] = rna_adata.X.toarray().sum(axis=1)
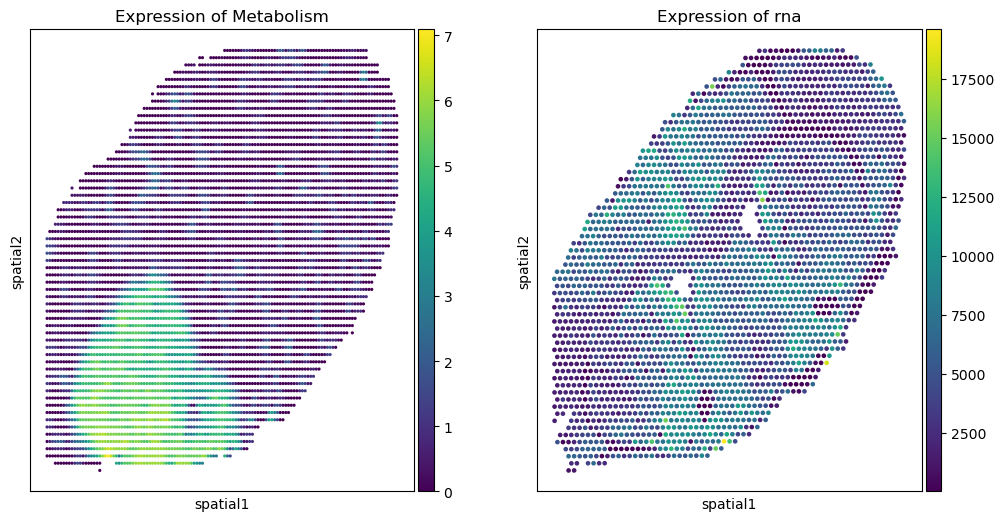
fig, axs = plt.subplots(1, 2, figsize=(12, 6))
sc.pl.embedding(saving_msi_adata, basis='spatial', color='sum', title=f'Expression of Metabolism', ax=axs[0], show=False)
sc.pl.embedding(rna_adata, basis='spatial', color='sum', title=f'Expression of rna', ax=axs[1], show=False)
/home/wzk/anaconda3/envs/pytorch_zk/lib/python3.8/site-packages/scanpy/preprocessing/_highly_variable_genes.py:64: UserWarning: `flavor='seurat_v3'` expects raw count data, but non-integers were found.
  warnings.warn(
[30]:
<Axes: title={'center': 'Expression of rna'}, xlabel='spatial1', ylabel='spatial2'>